Web
Core Web Vitals Guide: LCP, INP and CLS Explained
Core Web Vitals in plain English: what LCP, INP and CLS measure, Google's thresholds, how to check them in PageSpeed Insights and Search Console, what to fix.
 Christian Monge5 min read
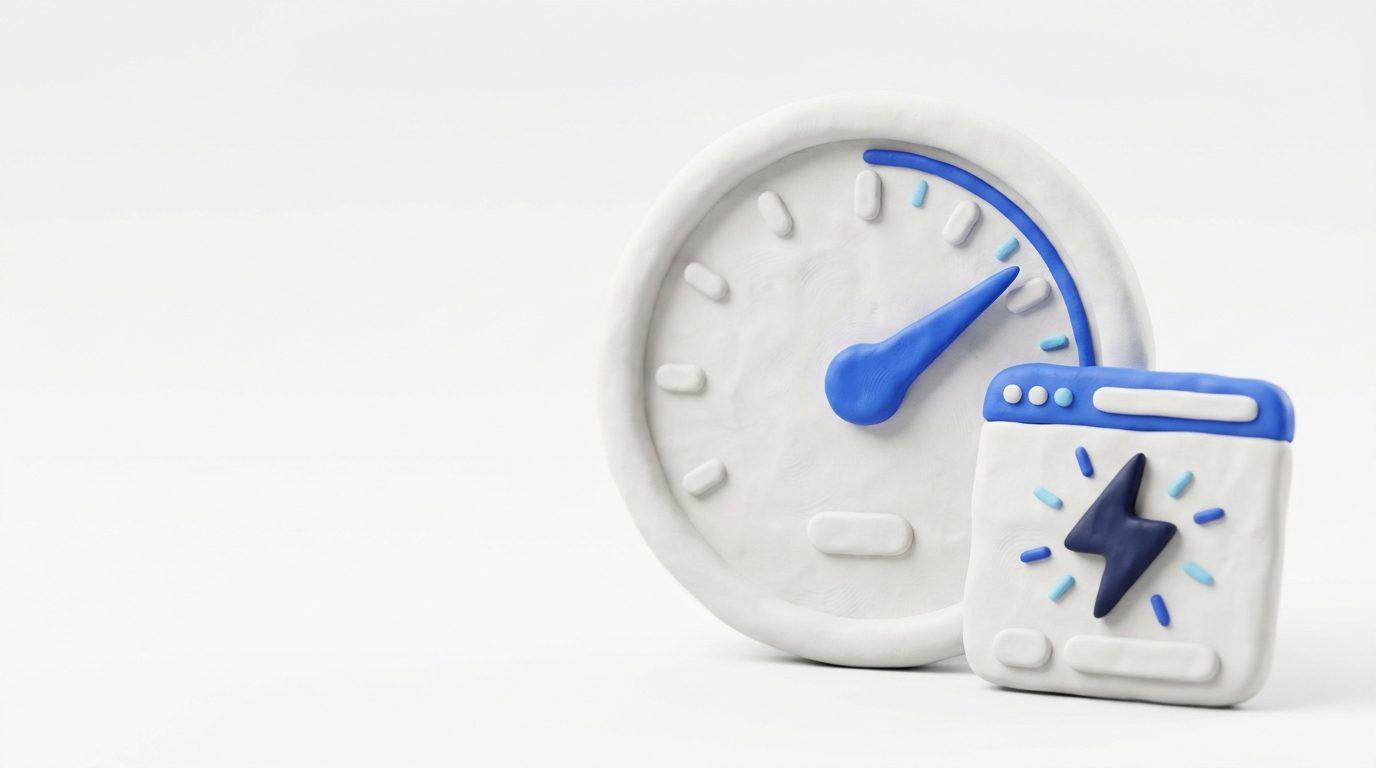
Core Web Vitals are three metrics Google uses to measure how real visitors experience your site: how fast the main content appears (LCP), how quickly the page reacts when someone taps (INP) and how much the layout shifts while loading (CLS).
"Core web vitals" gets 2,400 searches a month in the United States (Pengu Insights, Nov 18, 2026). This guide covers the official thresholds, how to measure them for free and the fixes that make sense on a small business site, using my own numbers as the example.
What LCP, INP and CLS measure
Each metric covers a different part of the experience: loading, responsiveness and stability.
LCP (Largest Contentful Paint). The time until the largest element in the first screen appears, usually the hero photo or the main headline. It is the "I can see the page" metric.
INP (Interaction to Next Paint). How long the page takes to react when someone clicks, taps a button or types. It tracks every interaction in the visit and reports the worst one, ignoring outliers. It replaced the old FID metric in 2024.
CLS (Cumulative Layout Shift). How much content moves without the visitor moving it. It is the button that jumps away just as you go to tap it because an image loaded above it.
Google's thresholds in 2026
A page passes when all three metrics are "good" at the 75th percentile of visits, measured separately for mobile and desktop. The 75th percentile means at least three out of four visits get that experience or better.
These are the cutoffs published in the PageSpeed Insights documentation:
| Metric | Good | Needs improvement | Poor |
|---|---|---|---|
| LCP | 2.5 s or less | 2.5 to 4 s | Over 4 s |
| INP | 200 ms or less | 200 to 500 ms | Over 500 ms |
| CLS | 0.1 or less | 0.1 to 0.25 | Over 0.25 |
The good thresholds match web.dev, Google's site for developers. If your site has too little traffic for INP data, PageSpeed Insights assesses the page on LCP and CLS alone.
Do Core Web Vitals affect rankings?
Yes, but less than many vendors claim. Google's page experience documentation says its ranking systems use these metrics.
The same page adds two caveats worth reading. There is no single "page experience" signal. And Google always tries to show the most relevant content, even when the page experience is sub-par. A good experience matters most when many equally helpful pages compete.
For a small business, that means: if your site takes six seconds to load on a phone, fix it, because people leave before they read anything. But do not expect going from 2.4 to 1.9 seconds to move you to the top spot.
How to measure them in PageSpeed Insights and Search Console
You measure them for free with two Google tools that complement each other: PageSpeed Insights for a single page and Search Console for the whole site.
- PageSpeed Insights (10 min). Go to pagespeed.web.dev, paste your home page URL, then repeat with your most visited service page. The top section shows field data: real Chrome users over the previous 28 days. Below it is lab data: a simulated Lighthouse test with a performance score from 0 to 100, where 90 or above is good, 50 to 89 needs improvement and below 50 is poor.
- Read the diagnostics (10 min). Under the score, the tool lists what is slowing the page down: heavy images, render-blocking code, elements without set dimensions. Write down the top three.
- Search Console (10 min). Open the Core Web Vitals report. It uses real-user data, groups URLs that behave alike and gives each group the status of its worst metric. There is one report for mobile and one for desktop.
- Validate the fix (28 days). After you fix something, click to start validation. Search Console monitors the issue for 28 days and marks it fixed if it does not show up again.
One warning for small sites: without enough visits, PageSpeed Insights falls back to data for your whole domain or shows no field data, and Search Console leaves out groups that lack data. Lighthouse also cannot measure INP, since nobody is tapping the page; it uses TBT (Total Blocking Time) as a stand-in.
A real example: my own home page
On November 18, 2026, I ran PageSpeed Insights on the Spanish version of my home page at christianmonge.com, on mobile. Result: performance 89, LCP 3.6 seconds, CLS 0 and TBT 110 milliseconds.
Quick read. CLS is perfect: nothing moves. TBT is low, so the page responds well. The problem is LCP: 3.6 seconds sits in "needs improvement." And 89 is one point short of green.
Since the LCP element is usually an image or a block of text, I started with image weight. My site runs on Next.js, and its Image component can serve AVIF, a lighter format, with one line of configuration. I turned it on. The images on that page dropped from about 730 KiB to 113 KiB, less than a sixth of the original.
No redesign needed. On a small site the problem is rarely complicated. Often it is just weight.
The fixes that pay off on a small site
On a small business site most problems come from four places, and almost all of them can be fixed without rebuilding.
Heavy images (LCP). Upload photos at the size they are displayed, not 4,000 pixels wide. Use modern formats such as WebP or AVIF. On WordPress, an image optimization plugin usually does the job.
A lazy-loaded hero image (LCP). The header photo should load first. If your theme lazy-loads it, turn lazy loading off for that one image only.
Elements with no size (CLS). According to web.dev's CLS guide, the usual causes are images and videos without dimensions, web fonts that load at a different size and ads or widgets that resize after loading. Reserve the space with width and height.
Too many third-party scripts (INP). Chat widgets, ad pixels, embedded maps, sliders. Each one keeps the browser busy. Remove the ones you do not use and load the rest only when needed.
| Problem | Metric | Rough fix time |
|---|---|---|
| Uncompressed photos | LCP | 30 min to 2 h |
| Lazy-loaded hero image | LCP | 15 min |
| Images without dimensions | CLS | 30 min |
| Unneeded scripts | INP | 1 to 3 h |
To see where this fits in a full site review, start with the SEO audit checklist.
If you are thinking of rebuilding your site because of speed, first read how much a website costs.
Want me to look at yours?
My SEO + AI audit is a one-off €390 + VAT. I measure your key pages on mobile and desktop and tell you what to fix first, including whether speed is worth touching or there are more urgent problems.
I also review your schema markup, your Google profile and whether AI assistants recommend you. If you would rather start small, ask for the free diagnostic video: 90 seconds on your site with the two or three fixes I would make first.
Frequently asked questions
What are Core Web Vitals?
Three metrics Google uses to measure real visitors' experience: LCP (how long until the main content shows), INP (how long the page takes to respond when you tap or click) and CLS (how much the layout jumps around while loading).
Do Core Web Vitals affect SEO?
Yes. Google says its ranking systems use them. It also says there is no single page experience signal and that it always tries to show the most relevant content, even when the experience is sub-par. Better scores help, but they do not rescue content that does not answer the search.
Why does PageSpeed Insights give different numbers each time?
Because it mixes two kinds of data. Field data comes from real Chrome users over the previous 28 days and moves slowly. Lab data is a simulated Lighthouse test that varies with each run depending on network and server conditions.
What happened to FID?
First Input Delay was replaced by INP as a stable Core Web Vital in 2024. INP looks at responsiveness across every interaction in a visit, not just the first one.
Does my small website even have Core Web Vitals data?
It depends on traffic. Without enough real visits, PageSpeed Insights falls back to data for your whole domain or shows none, and Search Console leaves out page groups without enough data. In that case, work from the lab test.
Sources

Christian Monge
Teaches AI workshops at EAE Business School, builds AI second brains with Obsidian and Claude Code, co-founded the competitive-intelligence SaaS Pengu Insights and publishes his Claude skills for free. Trains teams in English and Spanish from Madrid.
More about meSEO + AI audit
Want to know what your website is missing?
I review your site, your Google Business Profile and whether ChatGPT recommends you. Start with a free 90-second video, or go straight to the €390 audit.
See the SEO + AI auditKeep reading
Web
How Much Does a Website Cost? What Drives the Price
How much does a website cost in 2026: template vs custom, CMS, content, maintenance and hosting, with platform prices checked on 18 November 2026.

Web
What Is a Landing Page? Definition, Parts and Examples
What is a landing page, how it differs from your home page, the parts that make one work, structure examples and how a small business should use one.

AI News
AI Cyberattacks: Fake Identities and What to Do Now
AI cyberattacks in tests: Anthropic models hacked three organizations and an agent used fake identities. What is confirmed and five steps for small businesses.